Time Series Databases - Introducing librrdb
Time Series Databases
A Time Series Database (TSDB) is a database for storing metrics collected over time. The simplest example is the outdoor temperature collected periodically. This is different from a relational database (ex, MySQL, PostgreSQL, MSSQL) in that each metric is not really related to each other and the data is collected periodically. It’s possible to use a relational database as a TSDB, but it would be inefficient, have features than you need, and likely not have features that a TSDB would have.
The TSDB I cut my teeth on was RRDtool. Chris over at Wandering Thoughts has blogged quite a bit about their Prometheus and Grafana setups.
RRDtool
RRDtool is quite old - having first been released in 1999. There are definitely many more modern options, but there’s one advantage RRDtool has over the rest. The two things that would push someone to use RRDtool over the rest are:
- The database is a fixed size file.
- The library is entirely self-contained and embeddable (like SQLite).
The database being a fixed size means it is quite easy to figure out how much storage space you need to store a certain amount of metrics. The way RRDtool achieves this is by using a circular buffer that it calls a Round Robin Archive (RRA).
RRA’s are configured with a step size and lifetime. For example: you could store data with a 35 second step size (a data point stored every 35 seconds) and a lifetime of 6 months (the DB holds the last 6 months worth of samples). 6 months divided by 35 seconds is 450,514 data points. Since each data point is 4 bytes this RRA would consume approximately 1.8 MB.
The library being embeddable means it’s suited for “embedded” applications. Most of the other TSDBs are aimed at multi-system monitoring: watching fleets of servers, VMs, or networking equipment (or all of the above). This doesn’t work very well for IoT applications where devices are deployed singularly and are expected to be fully self-contained (like the products at my last job). RRDtool, while quite old, is still very capable in this segment.
librrdb
The one downside to RRDtool, at least for C++ projects, is that the API is very simple.
Most interaction with RRDtool can be done with shell scripting even.
The librrd library API is almost identical - you pass a list of strings and a count of strings (argc & argv convention).
While this is very simple and easy to interface with from just about every programming language available, it’s not very ergonomic for C++ developers.
At the last job, we developed a C++ wrqpper for librrd that we called librrdb. (naming is hard, okay?)
One of the biggest reasons for this was due to how RRDtool expressed durations.
We wanted (as C++ developers) to be able to use std::chrono to represent durations and timestamps.
RRDtool wants to use integer seconds or even a count of “rows” - in the above discussion about RRA “lifetime” I said “6 months” but RRDtool wants that expressed in number of rows (the 450,514 count).
This is not something we wanted the users of librrdb to have to worry about - they should just be able to express the step size with std::chronos::seconds{53} and the lifetime with std::chrono::months(6).
Unfortunately, that code is proprietary, so I can’t just dump it on Github. I can, however, reimplement it from scratch - which is what I’ve been doing over the last couple weeks. It’s not quite ready for posting, but here’s a sneek preview.
Suppose you’ve got a light sensor that you can easily read and you want to shove it in an RRD. Here’s how you can do that:
int main(int argc, char **argv)
{
    RRD::Database  db  = RRD::Database::open("/home/pi/workspace/RRD/qtpy-temperature.rrd", RRD::DBConfig{
        std::chrono::system_clock::now() - 10s, // Starting time, not really that important
        1s, // Base data collection rate
        { // List of data points being collected
            { "temperature", RRD::DSType::Gauge, 60s, std::nullopt, std::nullopt }, // A temperature reading collected at least every 60 seconds, with no minimum or maximum values
        },
        { // List of RRA configurations
            // Average,Min,Max with a 1 second precision and a 2 hour lifetime
            { RRD::CFType::Average, 0.9, 1s, 2h },
            { RRD::CFType::Minimum, 0.9, 1s, 2h },
            { RRD::CFType::Maximum, 0.9, 1s, 2h },
            /// Average,Min,Max with a 15 second precision and a 2 day lifetime
            { RRD::CFType::Average, 0.9, 15s, 24h * 2 },
            { RRD::CFType::Minimum, 0.9, 15s, 24h * 2 },
            { RRD::CFType::Maximum, 0.9, 15s, 24h * 2 },
            // Average,Min,Max with a 2 minute precision and a 2 week lifetime
            { RRD::CFType::Average, 0.5, 2min, 24h * 14 },
            { RRD::CFType::Minimum, 0.5, 2min, 24h * 14 },
            { RRD::CFType::Maximum, 0.5, 2min, 24h * 14 },
            // Average,Min,Max with a 10 minute precision and a 90 day lifetime
            { RRD::CFType::Average, 0.5, 10min, 24h * 90 },
            { RRD::CFType::Minimum, 0.5, 10min, 24h * 90 },
            { RRD::CFType::Maximum, 0.5, 10min, 24h * 90 },
        }
    });

    std::ifstream  ifs  {"/dev/ttyACM0"};

    std::string line;
    while (std::getline(ifs, line)){
        auto const data = parseLine(line);
        if (data){
            try {
                temp_db.addSample("temperature", data->temperature);
            } catch (std::exception &ex){
                fprintf(stderr, "Exception: %s\n", ex.what());
            }
        }
    }
    return 0;
}
This code will create the RRD database file if it doesn’t already exist and insert data into it. In my actual code, this is reading from a serial port connected to a QTPy which is connected to a number of sensors (including a temperature sensor). Once per second, that microcontroller reads the sensors and reports the data over the serial port. This application picks up that data and shoves it into the RRD database.
Creating graphs is similarly simple:
    RRD::GraphBuilder{}
        // Define time range we are interested in (last 14 days)
        .start(std::chrono::system_clock::now() - std::chrono::days(14))
        .end(std::chrono::system_clock::now())
        // Make the graph 1280x720
        .width(1280)
        .height(720)
        // Configure the vertical grid
        .unitsExponents(0)
        .leftAxisFormat("%3.1lf")
        .yGrid(0.25, 2.0)
        .lowerLimit(64)
        .upperLimit(80)
        .rigid()
        .title("Temperature (°F)")

        // Define data sources
        .def("temperature_avg", temperature_rrd_filename, "temperature", RRD::CFType::Average)
        .cdef("temp_f_avg", { "temperature_avg", "9.0", "*", "5.0", "/", "32.0", "+"})
        .vdef("temp_f_avgd", {"temp_f_avg","AVERAGE"})

        .def("temperature_min", temperature_rrd_filename, "temperature", RRD::CFType::Minimum, step)
        .cdef("temp_f_min", { "temperature_min", "9.0", "*", "5.0", "/", "32.0", "+"})
        .vdef("temp_f_mind", {"temp_f_min","MINIMUM"})

        .def("temperature_max", temperature_rrd_filename, "temperature", RRD::CFType::Maximum, step)
        .cdef("temp_f_max", { "temperature_max", "9.0", "*", "5.0", "/", "32.0", "+"})
        .vdef("temp_f_maxd", {"temp_f_max","MAXIMUM"})

        // Plot the data and build a legend
        .line("temp_f_avg", avg_color, "Average")
        .gprint("temp_f_avgd", "%3.1lf °F\n")
        .line("temp_f_min", min_color, "Minimum")
        .gprint("temp_f_mind", "%3.1lf °F\n")
        .line("temp_f_max", max_color, "Maximum")
        .gprint("temp_f_maxd", "%3.1lf °F\n")

        // Build the image!
        .graph("temp.png")
    ;
I won’t go into detail about all the commands - they follow the rrdgraph commands, just in a more C++ ergonomic way. What you get is an image like this:
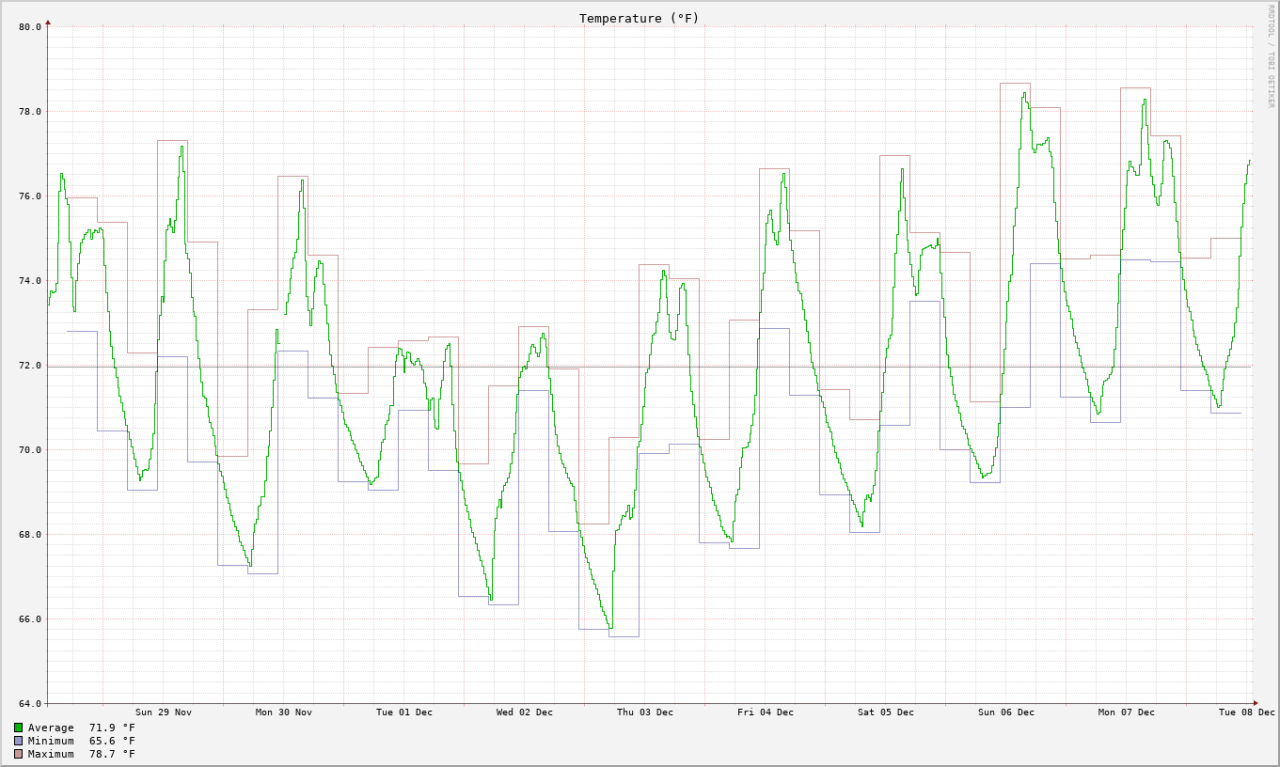
An example of a temperature graph over the last 14 days.
Hopefully I’ll be getting the last pieces done in the next couple weeks so I can get this library up on Github.